About Me
Currently Technical Product Manager for IBM Process Mining at IBM; former Head of Innovation, Data Scientist and Back-End developer.
Big Data lover, eager learner, teammate.


Experience
Business or sector Computer Vision, Health

Business or sector Process Discovery & Mining

Business or sector Financial Services, Big Data, R&D, Cloud

myInvenio
https://www.my-invenio.comSenior Engineer ML - Data Scientist
February 2019 - February 2020
Business or sector Process Discovery & Mining

Ubiq S.R.L. - SIA Group
https://www.sia.euComputer Engineer – Software Development Leader
March 2015 - February 2019
Business or sector Financial Services, Big Data

Datalogic ADC Inc
https://www.datalogic.com/eng/index.htmlSoftware Engineering Intern
August 2014 - February 2015
Business or sector Computer Vision

Education
Data Science and AI group in Parma
Member and speaker
October 2017 - Present
Speaker at public events on Machine Learning and Data Science topics

University of Bologna
Master's Degree in Computer Engineering QEQ7
September 2012 - March 2015
110/110 with Honours
Thesis Development of parallel processing approach to compute Zero-mean Normalized Cross- Correlation. CUDA framework has been used to develop fast approach to detect characters in images, using Template Matching approach, based on Zero-mean Normalized Cross-Correlation measure

University of Parma
Bachelor's Degree in Computer Engineering QEQ6
September 2009 - July 2012
107/110
Thesis A Machine Learning project based on arm gesture recognition and humanoid imitation. Arm gestures are acquired by inertial motion sensors and modelled in an OpenGL 3D virtual space. A new method based on Functional Principal Component Analysis is used in MATLAB for both a supervised clustering of training data and gesture recognition. Recognized gestures are imitated by a small humanoid robot

A Little More About Me
PERSONAL SKILLS
Languages Levels: A1/2: Basic user - B1/2: Independent user - C1/2 Proficient user - MT Mother Tongue
Communication Skills I gained good communication skills speaking and interacting with customers and clents. I'm also part of the Data Science and Artificial Intelligence Group in Parma, and I give a speech about Machine Learning topics once every few months, usually in front of dozens of peoples.
Organisational/managerial Skills Excellent social/organisational skills acquired during my experience as Team Leader/Area Manager.
Other Skills
Sport:
- American Football, 4 years’ experience in the Parma Panthers, interaction with American staff and players. Participation in European Championship with the Italian National American Football team
Driving License: B (own car)
JOB RELATED SKILLS
show the code
import matplotlib.pyplot as plt
import numpy as np
%matplotlib inline

import nltk
from nltk.corpus import stopwords
nltk.download('stopwords', quiet=True)
nltk.download('punkt', quiet=True)
from nltk.tokenize import word_tokenize
import string

from sklearn.feature_extraction.text import HashingVectorizer
from sklearn.manifold import TSNE
from sklearn.cluster import KMeans

working_experiences = pd.read_sql_query('SELECT * FROM work_experiences where employer in ("Datalogic", "Ubiq", "MyInvenio", "Cedacri", "IBM")', conn)
descriptions = working_experiences.drop(['employer', 'keyword'], axis=1)
keywords = working_experiences.drop(['employer', 'description'], axis=1)
employers = working_experiences.drop(['description', 'keyword'], axis=1)

def split_and_clean(input_string):
    return word_tokenize(str(input_string).lower().translate(str.maketrans('', '', string.punctuation)))

words = []
for idx in range(0, len(descriptions)):

    word_list = [word for word in split_and_clean(descriptions.iloc[idx]['description']) if not word in stopwords.words()]
    word_list += ([word for word in split_and_clean(keywords.iloc[idx]['keyword']) if not word in stopwords.words()])
    words.append(word_list)

hvec = HashingVectorizer(lowercase=False, analyzer=lambda l:l, n_features=2**10)
X = hvec.fit_transform(words)
tsne = TSNE(perplexity=5, method='exact')
X_embedded = tsne.fit_transform(X.toarray())

working_experiences['x'] = X_embedded[:,0]
working_experiences['y'] = X_embedded[:,1]

k = 7
kmeans = KMeans(n_clusters=k, n_jobs=8)
y_pred = kmeans.fit_predict(X_embedded)

from bokeh.models import ColumnDataSource, HoverTool, LabelSet, RadioButtonGroup, CheckboxGroup, Slider
from bokeh.transform import linear_cmap
from bokeh.palettes import Blues9
from bokeh.io import output_file, save, show
from bokeh.plotting import figure
from bokeh.layouts import column
from bokeh.models.callbacks import CustomJS

output_file("html/skills_scatter_plot.html")

y_labels = y_pred

# data sources
source = ColumnDataSource(data=dict(x= X_embedded[:,0], y= X_embedded[:,1], x_backup = X_embedded[:,0],
                                    y_backup = X_embedded[:,1], desc= y_labels, descriptions= working_experiences['description'],
                                    employers = working_experiences['employer'], keywords = working_experiences['keyword'],
                                    level = working_experiences['managerial_level']
                                    ))

# map colors
mapper = linear_cmap(field_name='desc', palette=Blues9,low=min(y_labels), high=max(y_labels))

# hover over information
hover = HoverTool(tooltips=[
    ("Employer", "<b>@employers{safe}</b>"),
    ("Keyword", "<b>@keywords{safe}</b>"),
    ("Description", "@descriptions{safe}")
    ],
    point_policy="follow_mouse")

p = figure(plot_width=650, plot_height=650, tools=[hover], title="Cluster of all Working Experiences", toolbar_location=None)
p.background_fill_color = "#323A48"
p.border_fill_color = "#323A48"
p.xaxis.major_label_text_color = None
p.yaxis.major_label_text_color = None
p.xgrid.grid_line_color = None
p.ygrid.grid_line_color = None
p.title.text_color = "white"

# plot
p.scatter('x', 'y', size=10, source=source, fill_color=mapper, line_alpha=0.3, line_color="black")

labels = LabelSet(x="x", y="y", text="keywords", y_offset=-20, text_font_size="9pt", text_color="#FFFFFF",
                      source=source, text_align='center')
p.add_layout(labels)

work_labels = ['All'] + list(working_experiences.employer.unique())

option = RadioButtonGroup(labels=work_labels, active=0)
skill_type_slider = Slider(start=1, end=3, value=1, step=1, title="Managerial Level")

callback = CustomJS(args=dict(p=p, source=source, level=skill_type_slider, option=option), code="""
    var radio_value = option.active;
    const current_level = level.value;

    var x = source.data.x;
    var y = source.data.y;
    var x_orig = source.data.x_backup;
    var y_orig = source.data.y_backup;
    var employers = source.data.employers;
    var levels = source.data.level;

    for (var i = 0; i < x.length; i++) {
        if((levels[i] >= current_level) && (employers[i] == option.labels[radio_value] || option.labels[radio_value] == 'All')) {
            x[i] = x_orig[i]
            y[i] = y_orig[i]
        } else {
            x[i] = undefined
            y[i] = undefined
        }
    }

    p.title.text = 'Cluster of Working Experiences in ' + option.labels[radio_value]

    source.change.emit();

""")

option.js_on_click(callback)
skill_type_slider.js_on_change('value', callback)

checkbox_group = CheckboxGroup(labels=['Labels'], active=[0])
checkbox_group.js_on_click(CustomJS(args=dict(labels=labels),code="""
    if(this.active == '0') {
        labels.visible = true
        console.log('true')
    } else {
        labels.visible = false
    }
    labels.change.emit();
"""))

show(column(column(column(column(option),checkbox_group), skill_type_slider),p))
show the code
import os
from PIL import Image
import numpy as np
import matplotlib.pyplot as plt
from scipy.ndimage import gaussian_gradient_magnitude
from wordcloud import WordCloud, ImageColorGenerator, STOPWORDS
# get data directory (using getcwd() is needed to support running example in generated IPython notebook)
d = os.getcwd()
# load wikipedia text on rainbow
text = long_text
# load image. This has been modified in gimp to be brighter and have more saturation.
background_color = np.array(Image.open(os.path.join(d, "images/background.jpeg")))
# subsample by factor of 3. Very lossy but for a wordcloud we don't really care.
background_color = background_color[::3, ::3]
# create mask white is "masked out"
background_mask = background_color.copy()
background_mask[background_mask.sum(axis=2) == 0] = 255
# some finesse: we enforce boundaries between colors so they get less washed out.
# For that we do some edge detection in the image
edges = np.mean([gaussian_gradient_magnitude(background_color[:, :, i] / 255., 2) for i in range(3)], axis=0)
background_mask[edges > .08] = 255
stopwords = set(STOPWORDS)
stopwords.add("different")
stopwords.add("development")
# create wordcloud. A bit sluggish, you can subsample more strongly for quicker rendering
# relative_scaling=0 means the frequencies in the data are reflected less
# acurately but it makes a better picture
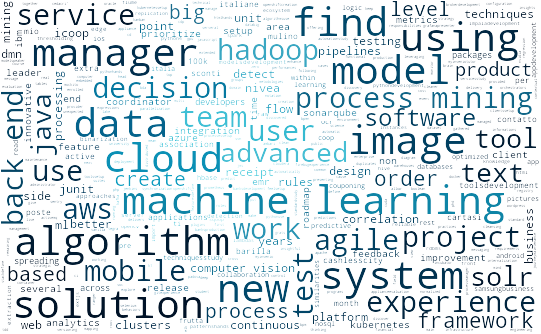
wc = WordCloud(max_words=2000, mask=background_mask, max_font_size=40, random_state=42, relative_scaling=0, stopwords=stopwords, background_color="rgba(255, 255, 255, 0)", mode="RGBA")
# generate word cloud
wc.generate(text)
# create coloring from image
image_colors = ImageColorGenerator(background_color)
wc.recolor(color_func=image_colors)
plt.figure(figsize=(15, 10))
plt.imshow(wc, interpolation="bilinear")
plt.axis("off")
wc.to_file("images/word_cloud.png")
plt.show()
show the code
def show_skills_plot(x_label, output_file_name, skills=None):
  if skills is None:
      raise Exception("you should have at least one skill, shouldn't you?")
  from bokeh.io import show, output_notebook
  from bokeh.plotting import figure
  from bokeh.palettes import Blues9
  from bokeh.transform import factor_cmap
  from bokeh.models import ColumnDataSource
  output_file(output_file_name)


  source = ColumnDataSource(skills)

  TOOLTIPS = """
      <div style="width:300px">
          <table>
              <tr><td style="color:DodgerBlue;">Name</td><td style="text-align: center;"><b>@description</b></td></tr>
              <tr><td style="color:DodgerBlue;">Type</td><td style="text-align: center;">@subtype</td></tr>
              <tr><td style="color:DodgerBlue;">Details</td><td style="text-align: center;">@tooltip</td></tr>
          </table>
      </div>
  """

  p = figure(plot_width=700, plot_height=400, title="Expertise level",
             x_range=list(skills.description), toolbar_location=None, tooltips=TOOLTIPS)

  index_cmap = factor_cmap('subtype', palette=Blues9, factors=sorted(skills.subtype.unique()), end=1)
  p.vbar(x='description', top='level', width=1, source=source,
         line_color="white", fill_color=index_cmap)

  p.y_range.start = 0
  p.y_range.end = 10
  p.x_range.range_padding = 0.1
  p.xgrid.grid_line_color = None
  p.xaxis.axis_label = x_label
  p.xaxis.major_label_orientation = 1.2
  #p.xaxis.major_label_text_color = 'white'
  #p.yaxis.major_label_text_color = 'white'
  #p.xaxis.axis_label_text_color = 'white'
  p.outline_line_color = None
  #p.background_fill_color = "#323A48"
  #p.border_fill_color = "#323A48"
  #p.title.text_color = "white"

  show(p)

job_skills = pd.read_csv('legacy/job_skills.csv', sep=';')
job_skills['subtype'] = job_skills.apply(lambda x : x.type if pd.isna(x.subtype) else x.subtype, axis=1)
ADDITIONAL INFORMATION
Publications
Arm Gesture Recognition and Humanoid Imitation Using Functional Principal Component Analysis,
J. Aleotti, A. Cionini, L. Fontanili, S. Caselli,
IEEE/RSJ International Conference on Intelligent Robotics and Systems (IROS),
Tokyo, November 2013
Challenges
Generali Data Challenge: top 10 finalist
Speaking
BPMNext 2019: Process Mining and DTO — How to Derive Business Rules and ROI from the Data
Cloud, the “New Normal”: Casi concreti di trasformazione e innovazione nel settore dei servizi finanziari
Honours and awards
Bronze medal of sporting merit given by CONI
Projects
- Development of projects of personal interest using latest mobile and web programming languages (Android, HTML, CSS, SQL, JavaScript, Python) and tools (Nutch crawler, SonarQube, Tesseract).
- Parma Panthers Official: development of the Android official application of the Parma Panthers, the American Football team 4 times champion of Italy in the main championship,
- pysqoop: a Python package that lets you sqoop into HDFS data from RDBMS using Apache Sqoop (installable via pip).
- Coinbase trading bot: a serverless Python bot running on AWS Lambda that trades crypto on Coinbase and that can be interacted with via Telegram Bot.
- Member & Speaker of the Data Science & AI Group in Parma